Throughput vs Quality: The Two Numbers an Autoblog Must Report Together

A rising publish count feels like proof the line is working. It is not. Content throughput is an operations number: real capacity against the plan. It says nothing about whether the pages that cleared the queue are still worth keeping.
BlogSEO defines throughput as publishable articles divided by total production hours, not drafts generated. In their worked example, 80 production hours for four published posts is one article per 20 hours. That formula only counts pieces that met the publish contract. A faster generator that ships more drafts, or more pages that fail review, has not raised throughput.
Pair that count, on the same line, with a leading quality floor: first-pass quality-gate rate, edit-hours per shipped article, or the share of published URLs that earn Search Console clicks. Google has not published a safe articles-per-month limit. Scaled content abuse is purpose and value at scale, whether humans, automation, or both produced the pages. Rankings and traffic lag the line by weeks, so the monthly sheet leads with the paired ops numbers. If the quality floor misses its baseline, do not celebrate throughput and do not raise the cadence.
- Throughput counts only articles that cleared the publish contract, divided by production hours — not raw drafts.
- A publishable count is incomplete until a quality-floor number sits on the same line.
- Useful floors include first-pass gate rate, edit-hours per shipped article, and the share of URLs that earn Search Console clicks.
- Google has not published a volume limit; scaled content abuse is low-value pages made mainly to manipulate rankings.
- If the quality floor misses its baseline, hold the cadence. Do not wait for lagging traffic to confirm the miss.
How to Calculate Content Throughput for an Autoblog
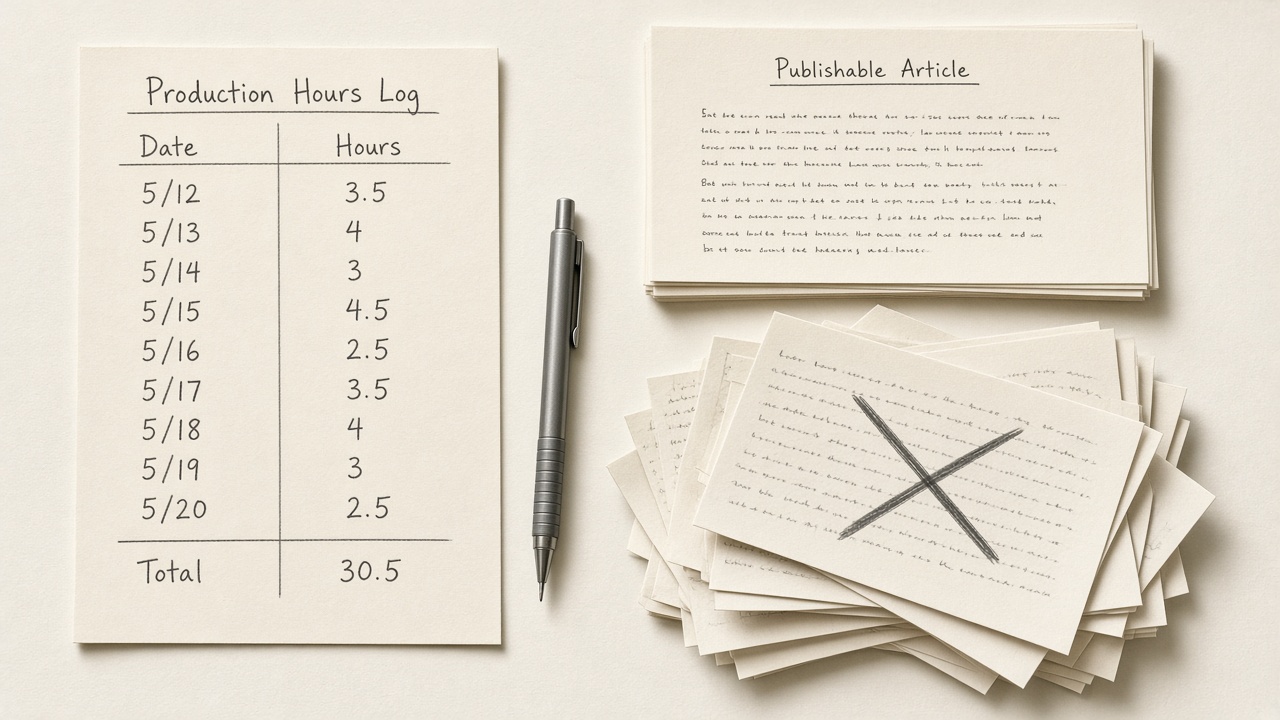
Count only pages that met the publish contract in the numerator, and put total production hours in the denominator. BlogSEO’s worked example of low throughput — 80 hours for four published posts, or one article per 20 hours — shows the arithmetic, not a pace to copy. Log those hours, not the generator’s draft pile.
Indexed URLs confirm the line later; they are not the monthly throughput field. Beside the hourly rate, log pieces published per month — real capacity versus the plan, separate from marketing outcomes. Neither reading includes drafts.
Orbit Media’s 2026 blogging survey of 1,042 content marketers found an average blog post takes 3 hours 20 minutes to write before review and publication. That clock stops before review, so it is not the full production-hour denominator, and it is not a target for the autoblog’s own rate. Draft engines multiply words; they do not replace those hours.
Count publishable pages — Throughput is publishable URLs over production hours, or pieces published per month — never drafts, and not indexed URLs.
What Quality Number Has to Sit Next to the Publish Count?

The number that has to sit next to that publish count is a leading quality floor you can log before rankings move. For a small stack, use first-pass quality-gate pass rate: assets that passed quality gates with zero manual edits, divided by total assets reviewed.
Hold 60 to 70 percent as the baseline and 80 percent or more as the stretch. Pick one floor for the monthly pair. Edit-hours per shipped article and click share are alternate floors, not extra numbers on the same line.
One floor — Pair throughput with first-pass quality-gate pass rate, and treat a miss of the 60 to 70 percent baseline as a hold, not a scale win.
QA Pass-Rate Benchmarks
Is Content Velocity the Same as Content Throughput?
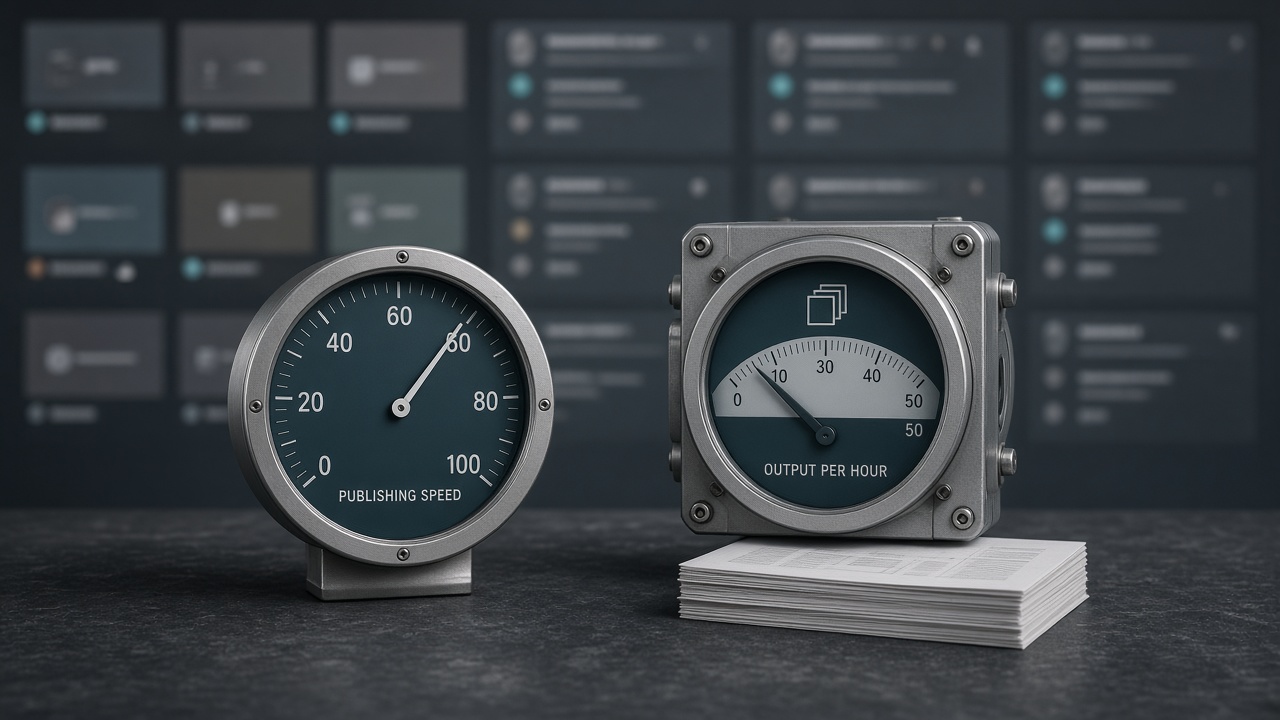
No. Velocity is how fast the calendar ships. Throughput is publishable output per production hour, or pieces published against capacity. A faster schedule is not the throughput number.
A higher publishing rate is not a documented policy trigger. Policy judges purpose and value at scale, whether automation, humans, or both produced the pages. Generative AI used to make many pages without added value is an explicit example of abuse, not evidence that speed is scored. Helpful-content guidance treats extensive automation across many topics, and mass production that leaves pages with less care, as warning signs of search-engine-first content.
If velocity rises while CTR, conversions, and engagement fall, the line is past its quality capacity. BlogSEO’s Q1 2025 client comparison of 143 domains reported top-100 keywords up 62 percent for sites shipping at least one auto-generated article a day, versus 27 percent for a 56-domain manual control. That is a vendor client study, not a Google reward, and not a reason to drop the floor.
One analysis of 247 sites described a compounding band of 8 to 16 posts per month, with 187 percent average year-over-year organic growth inside the band versus 54 percent below it and 89 percent above it. In that analysis, pushing past 24 posts a month coincided with median length falling from 1,847 words to 982 and average position dropping 14 percent after month three. Frame that as an observational caution, not a Google quota.
Not the same number — Velocity is calendar speed; throughput is publishable output per hour or against capacity. A faster schedule is not a documented policy trigger, and rising velocity with falling engagement means the line has outrun its quality capacity.
How Many Articles a Month Is Safe Under Scaled Content Abuse?

Google has not published a page count, publishing rate, or ratio that triggers scaled content abuse, so volume alone is not a documented violation. There is no safe articles-per-month number for a one-person operator to look up. The exposure is publishing without a quality floor, not missing a hidden cap.
Scaled content abuse is many pages generated mainly to manipulate rankings rather than help users, typically unoriginal content with little or no value, no matter how it is created. After the March 2024 core update finished on April 19, 2024, Google reported 45 percent less low-quality, unoriginal content in results. The target was unhelpful scaled content, not a cadence cap.
That hold is fail-closed. When quality scores fall as volume rises, match the shipping rate to what you can actually review, rather than hunting for a monthly quota Google never set.
No quota — There is no safe monthly article count. Miss the quality-floor baseline and cut cadence to review capacity; a higher publish count is not a win.
How Edit-Hours and Click Share Show Quality Slipping as Volume Rises

The hold is easier to see in edit-hours per article: total editing time divided by assets shipped. A stated baseline is 1.0 hour, with a stretch of 0.5 hour or less. If that figure rises with the publish count, repair time is growing per URL. That is quality slipping, not a scale win.
At 40 assets a month, 1.5 edit-hours each, and $80 per editor hour, rework alone is $4,800 a month. A solo operator may not pay that rate, but those hours still come from the same person.
Click share is pages with Search Console clicks divided by pages published. No universal percent is required; track your own baseline. A higher publish count with a shrinking share of pages that earn any clicks means the extra URLs are not earning a place.
Edit-hours can be logged as each asset ships, so a rise shows up while the month is still open. Click share can be read only after Search Console shows whether those URLs earned any clicks. One warns during editing; the other audits demand after the fact.
Slip signal — Rising edit-hours mean repair is growing with volume; a shrinking click share only later shows the extra URLs never earned a place. Neither number replaces the quality floor on the monthly pair.
How Impressions per URL Keep a High Publish Count Honest
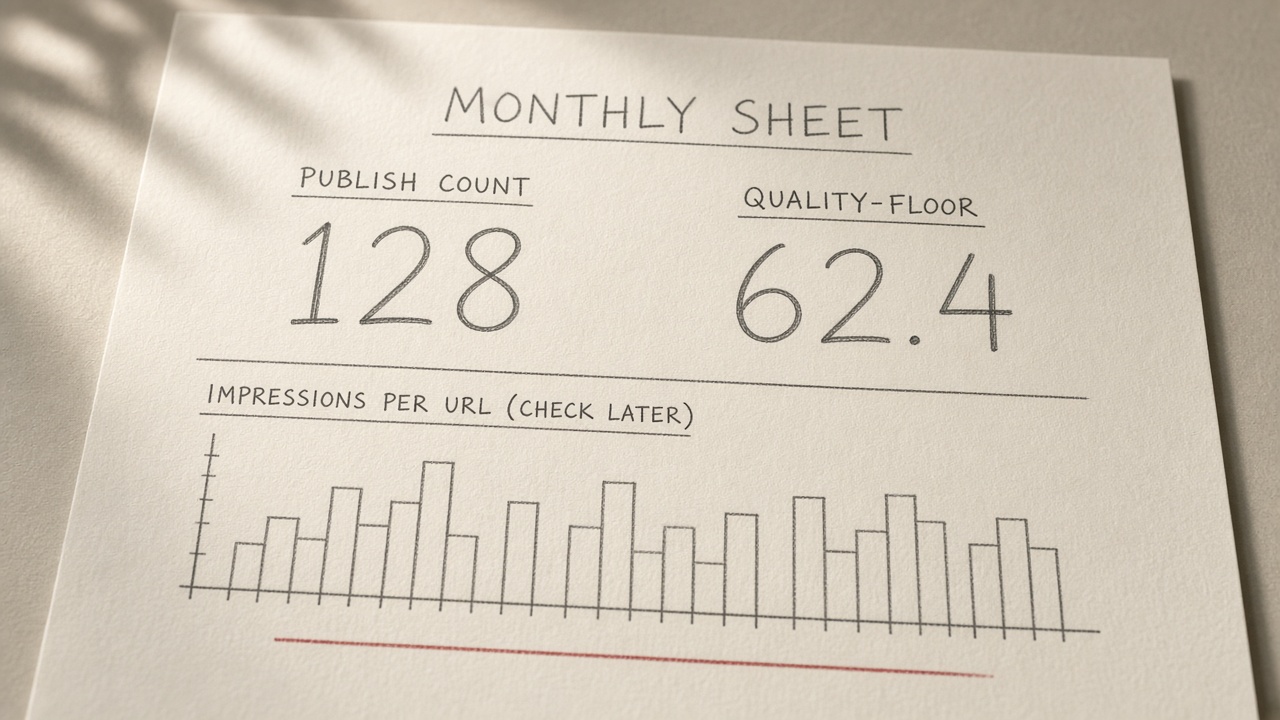
Impressions per URL at 30, 60, and 90 days, plus indexed articles per month, sit beside published articles per month. A high publish count that never becomes indexed URLs or impressions per URL is inventory, not demand.
A 2021 study of 109 content professionals found 46 percent of organizations at the two earliest content-operations maturity levels. At that stage, a solo operator will not keep a rebuilt dashboard. Link the existing ops sheet and autoblog KPI one-pager, and log the two numbers already chosen rather than a new report.
Confirm, don't replace — Impressions per URL and indexed articles confirm the throughput-and-floor pair weeks later; they do not replace the quality floor logged first.
Does Automating Drafts Remove the Need to Report Quality?

Those later checks only count if the page was reviewed first. No: automating drafts changes hours and cost. It does not retire the quality number or let an unreviewed URL enter the throughput numerator.
A four-article monthly manual workflow is estimated at 40 to 56 hours, versus 8 to 15 hours with automation that still includes human review. Those review hours stay inside the throughput calculation.
One client comparison reported 3.2 times more publishable words per dollar after an automated pipeline. Cost efficiency is not a quality floor.
Google’s quality-rater guidance treats generative AI used to produce large amounts of text without manual oversight or curation as little to no effort. An October 1, 2026 guidance note reported by PPC Land said all AI-generated content should be manually fact-checked before publication, including titles, meta descriptions, structured data, and alt text. The full list stays in the existing quality-guardrails article.
Still report quality — Automation can cut hours and raise words per dollar, but a live URL that no human has checked against the publish contract is still a draft and cannot enter the throughput numerator.
Key Takeaways
Log this month’s throughput beside your quality-floor pass rate before you raise cadence, and use the Flowcrews concierge if you want that two-number sheet set up against your existing ops KPIs.
Frequently Asked Questions
You Might Also Like
- Measurement Content Operations KPIs: The Monthly Sheet for Automated Publishing
- Measurement KPIs for an Autoblogging System: What to Report Monthly
- Measurement Content Ops Metrics That Survive a One-Person Review
- Measurement Search Console for Content Ops: Queries That Should Become Briefs
- Measurement How to Prioritize a Content Decay Audit When You Publish Weekly