KPIs for an Autoblogging System: What to Report Monthly

Most teams running content automation still score the machine with the same charts they used before AI. In a 2026 survey of more than 1,200 content marketers, 74% used AI in the workflow, yet only 19% of those AI users had measurement frameworks that specifically tracked AI-related performance indicators. The other 81% kept pre-AI KPIs. That is how an autoblogging system looks productive while it piles up pages nobody should have shipped.
A monthly sheet for this kind of system is not a traffic dashboard. It is a fail-closed one-pager with three layers: production efficiency, index and quality gates, and business outcomes. Velocity and cost per content unit come first, measured against a pre-AI baseline. Indexation is reported by template or cluster, not as a sitewide average. Human edit rate is a publish gate, not a vanity percentage. And the sheet has to show the work itself — pages published, held, rewritten, submitted for indexing, and internal links added — so a quiet month cannot be mistaken for a healthy one.
Read that sheet on a monthly cadence with a 90-day Search Console window. Do not treat month-one sessions as content marketing ROI. Cited B2B SaaS SEO benchmarks put breakeven near month seven. The rest of this guide is the report in the order you should fill it: what the line produced, whether Google could use it, and whether the business should keep funding it.
- Report three layers every month: production efficiency, index and quality gates, and business outcomes.
- Only 19% of AI-using content marketers track AI-specific KPIs; 81% still measure with pre-AI metrics.
- Baseline content velocity and cost per unit before you celebrate traffic from automated blog posts.
- Hold a 25% to 40% human revision band, and alert if any template falls under 80% indexed.
- Review on a 90-day window; month-one traffic is not ROI, and breakeven for B2B SaaS SEO content is nearer month seven.
What KPIs should an autoblogging system report every month?
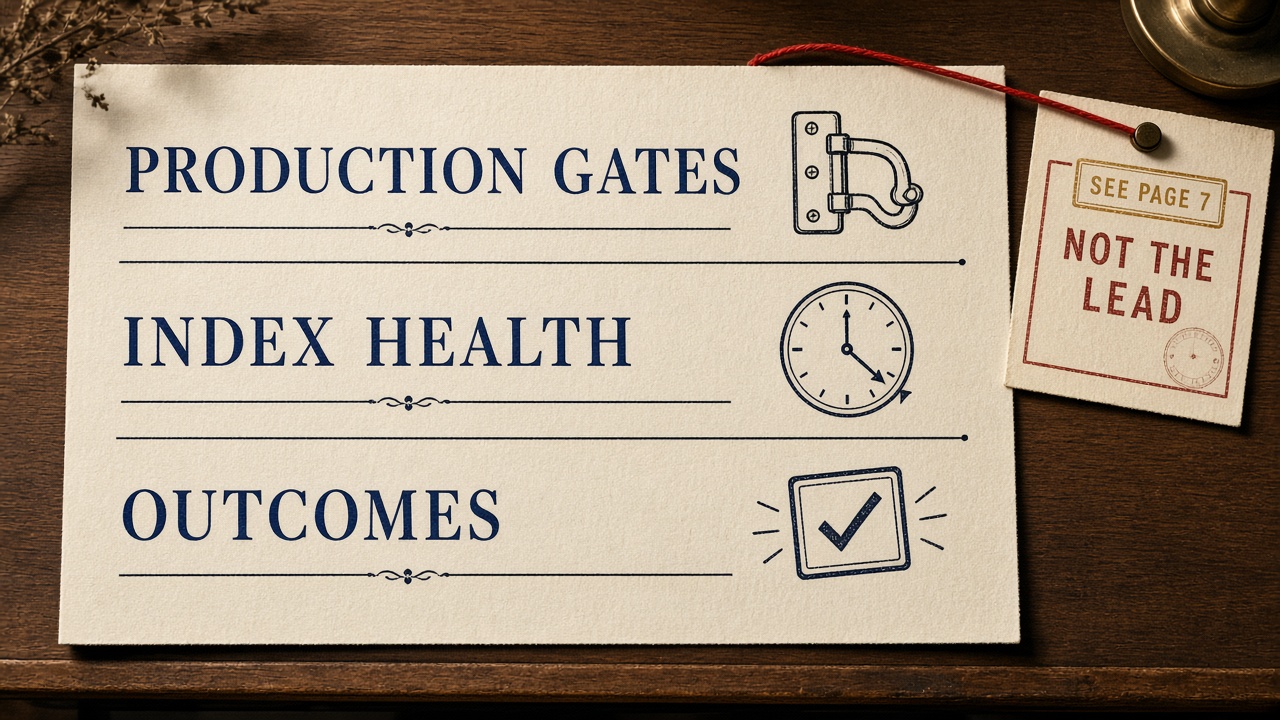
The monthly question is whether the publish contract held, not whether a traffic chart moved. A content automation KPI judges that contract — held, edited, indexed, and cost per indexed URL — not a downstream SEO metric such as clicks or average position. Traffic alone hides thin-content debt.
The same gap shows up beyond AI-specific scorecards. In Content Marketing Institute 2026 B2B research of 1,015 marketers, 33% said they struggle to measure content effectiveness, their third-biggest challenge, so a pre-AI traffic chart still does not answer whether this system should keep shipping.
Name the minimum set up front: velocity by content type versus a pre-AI baseline, cost per unit, edit rate, template indexation, cannibalization, crawl lag, work completed, and a separated outcome line. The pipeline itself is defined in the autoblogging explainer; this sheet only scores whether that contract held.
Three layers — A useful monthly sheet scores the publish contract — held, edited, indexed, and cost per indexed URL — on its own lines, so outcomes cannot stand in for a gate the line failed.
2026 Content Measurement Gaps
What a one-page monthly scorecard should lead with
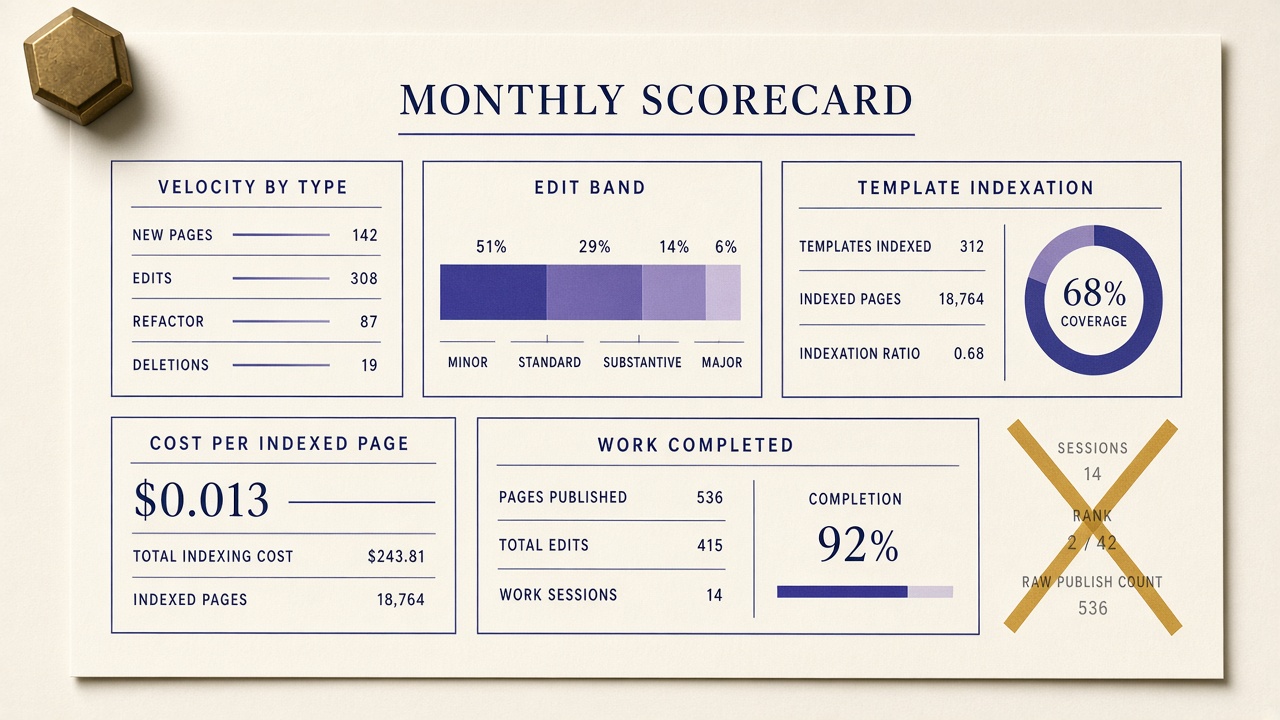
A lean publishing stack fits on one page only if the headline is the publish contract. Put five blocks up top: velocity versus the pre-AI baseline by content type, the quality gate, index health by cluster, unit cost, and work completed. Park business outcomes in a footer so month-one sessions cannot outrank those gates.
After full AI integration, the disciplined velocity target is 2x to 4x the pre-AI baseline within six months, tracked by content type rather than one sitewide number. Refuse to lead with sessions, raw publish count, average position, or vendor headlines such as a 3.4x velocity jump and a 67% cost-per-piece cut. Those are claims, not gates.
Rank misleads on its own. One framework says position-1 organic click-through rate fell to 2.6% from 7.3% in 2024 because of AI Overviews. Industry tracking still skews to traffic — 87% of content teams track website traffic, only 31% track revenue attribution — so the scorecard must not let the majority metric set the lead.
Score the contract — Lead the monthly page with velocity by type, quality, index health, unit cost, and work completed; treat sessions, raw volume, average position, and vendor multiples as claims, not the score.
Cost per published article vs. cost per indexed page — and ROI without full attribution
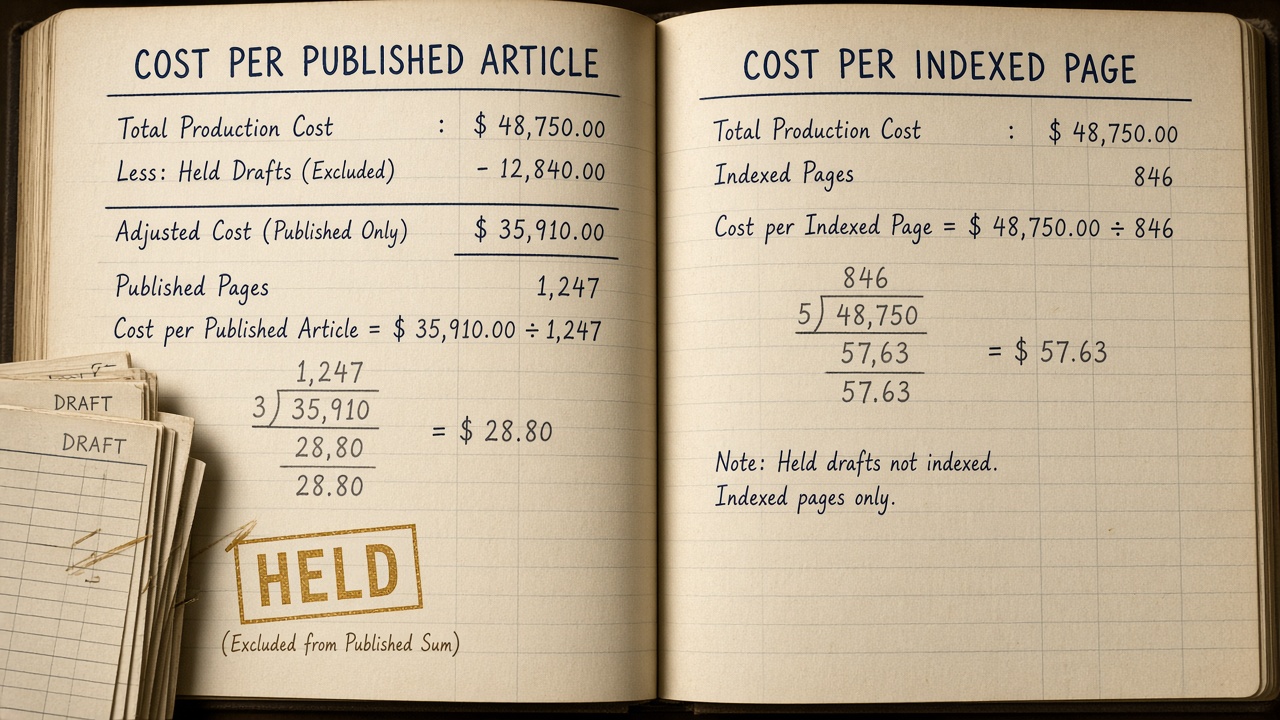
Unit cost is already a headline block; the useful version splits it. Cost per published article equals monthly tooling plus human review plus distribution, divided by articles that passed the publish gate. Held drafts stay out of the denominator.
Cost per indexed page uses that same numerator, divided only by URLs from that cohort that are indexed in the reporting window. Published-but-not-indexed URLs stay in the first denominator and drop out of the second.
Track cost per content unit monthly against a pre-AI baseline. For standard formats the stated target is a 40% to 70% reduction. If published cost falls while indexed cost rises, the stack is cheaper to ship and more expensive to earn.
Without a full attribution model, pair the indexed-cost trend with time-to-value. Cited benchmarks put median three-year ROI for SEO-driven content at 748%, B2B SaaS at 702%, and breakeven near month seven. The full fail-closed ROI scorecard belongs in the existing SEO ROI article, not this monthly sheet.
Two costs — Same spend, two denominators: published cost shows what shipped, indexed cost shows what Search earned. A falling publish cost with a rising index cost is thin-content debt.
What is a healthy indexation rate for automated pages?
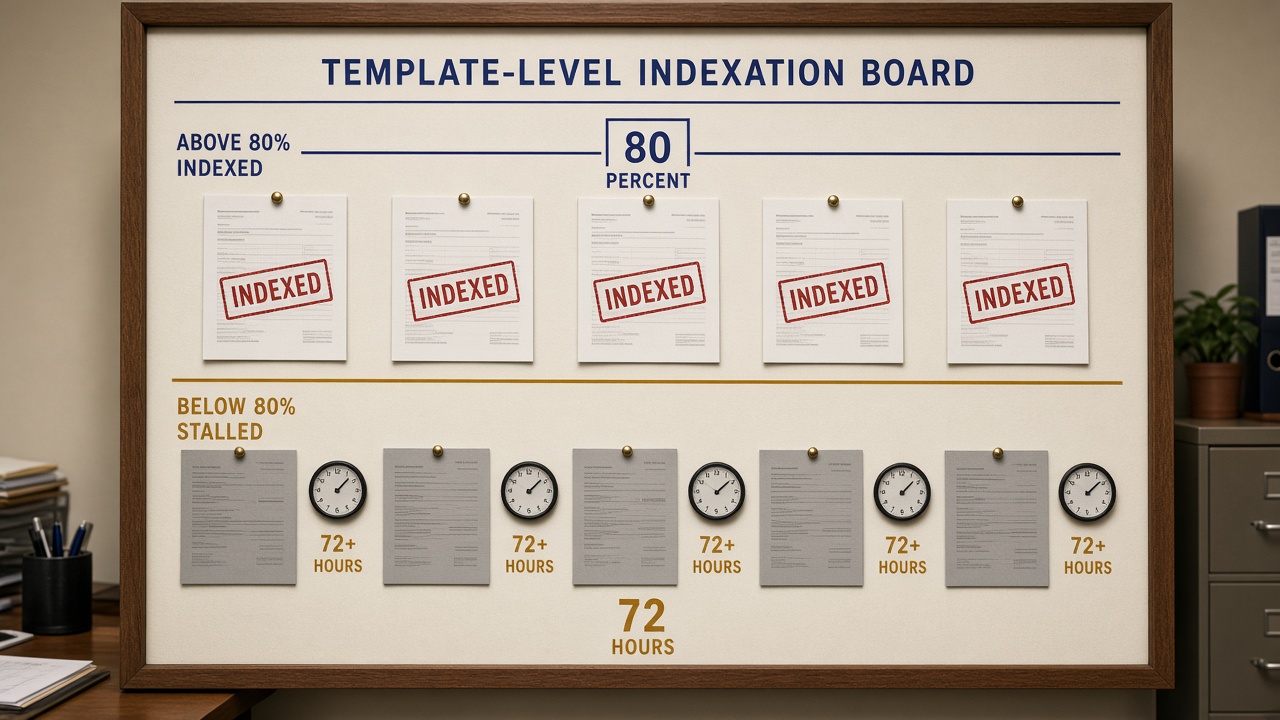
Once cost is counted only on pages that actually enter the index, the next monthly question is whether that rate is healthy. For automated or programmatic pages, measure indexation by template or cluster: indexed pages divided by total pages in that template. Alert when any template drops below 80%. A sitewide average can look fine while one broken cluster never gets in.
Publishing volume is outrunning crawl when new pages are not crawled within 72 hours, crawl errors spike above 5% for a template, or a large share of a new template is never requested. A scaled programmatic launch found 60% of its newest template was not being crawled because of internal linking, while operators assumed every page was indexed.
Compare this month’s published cohort with crawled and indexed counts for that same cohort. If the published count rises and the indexed share falls, pause the template and fix links and submission before you read rankings.
Watch the template — A healthy automated-page indexation rate is 80% or better on every template, not a sitewide average — and rising publish volume with a falling indexed share means pause, not celebrate.
What edit rate means the gate is too loose — and when to refresh instead
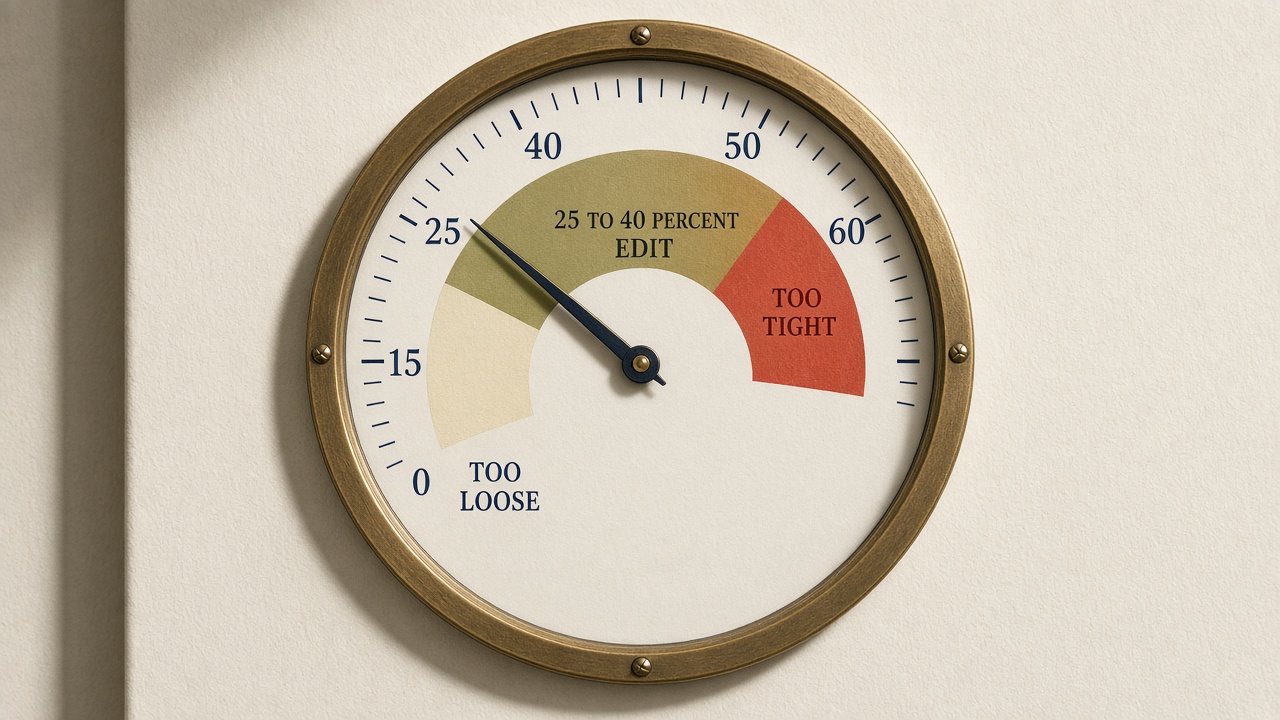
Index health is only one reason to stop the line. The stated revision target — substantive human revision on published pieces — is 25% to 40%. An AI edit rate above 60% suggests prompts or tools are failing the gate; below 15% may mean too little human oversight, which is how thin pages ship. Either miss freezes velocity; it does not raise it.
Use the same freeze when a template's indexation is under 80%, keyword cannibalization exceeds 5% (keywords with multiple ranking pages divided by total target keywords), or a lead-generation template converts below 2%. Those readings trigger a refresh or a pause, not more publishing. Undetected cannibalization from a new template launch has been associated with a 40% organic traffic loss. Log that trigger and stop the line; cluster repair belongs in the automation playbooks, not on this scorecard.
Freeze the line — Hold the revision target at 25% to 40%. An AI edit rate above 60% points to prompt or tool problems, and a rate below 15% may mean too little human oversight. Freeze velocity and refresh — do not publish more — when a template is under 80% indexed, over 5% cannibalized, or under 2% lead conversion.
Should AI Overview impressions be in the monthly report?
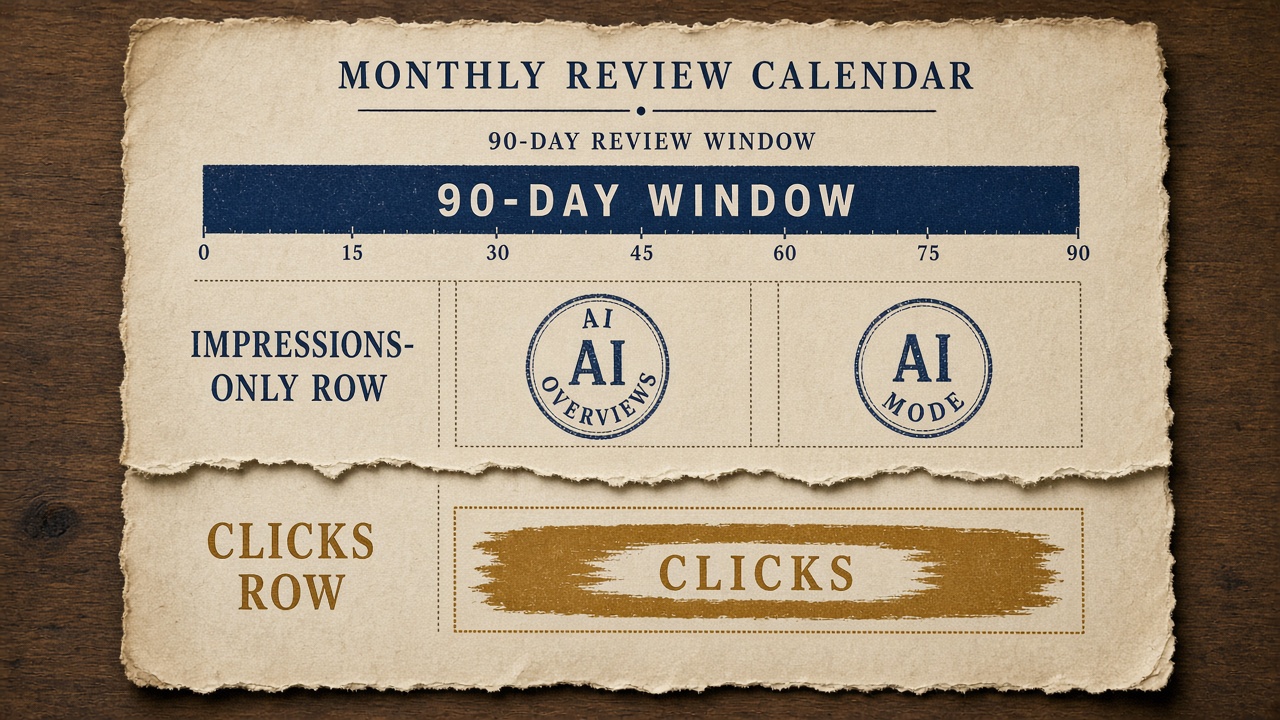
Once the publish and index gates are already on the sheet, the visibility question is simpler: yes, add generative AI impressions as their own 2026 line for AI Overviews and AI Mode. Do not fold that line into classic clicks or CTR. Google launched Search Console generative AI performance reports on June 3, 2026, covering impressions in those features, and rolled the insights out to all websites worldwide as of August 31, 2026.
That report shows impressions, pages, countries, devices, and dates. It does not show clicks, CTR, average position, or queries. Label the scorecard line impressions-only so a rise in AI visibility is never mistaken for a rise in traffic.
Review the report monthly. For most B2B marketing sites, read Search Console and GA4 on a 90-day window so one publish week does not swing the verdict. Production gates can be counted on the calendar month; index and click outcomes should not.
Separate line — Put AI Overview and AI Mode impressions on the monthly scorecard as a separate, impressions-only line, and judge Search Console and GA4 outcomes on a 90-day window rather than the publish month.
How to separate new pages from refreshed pages
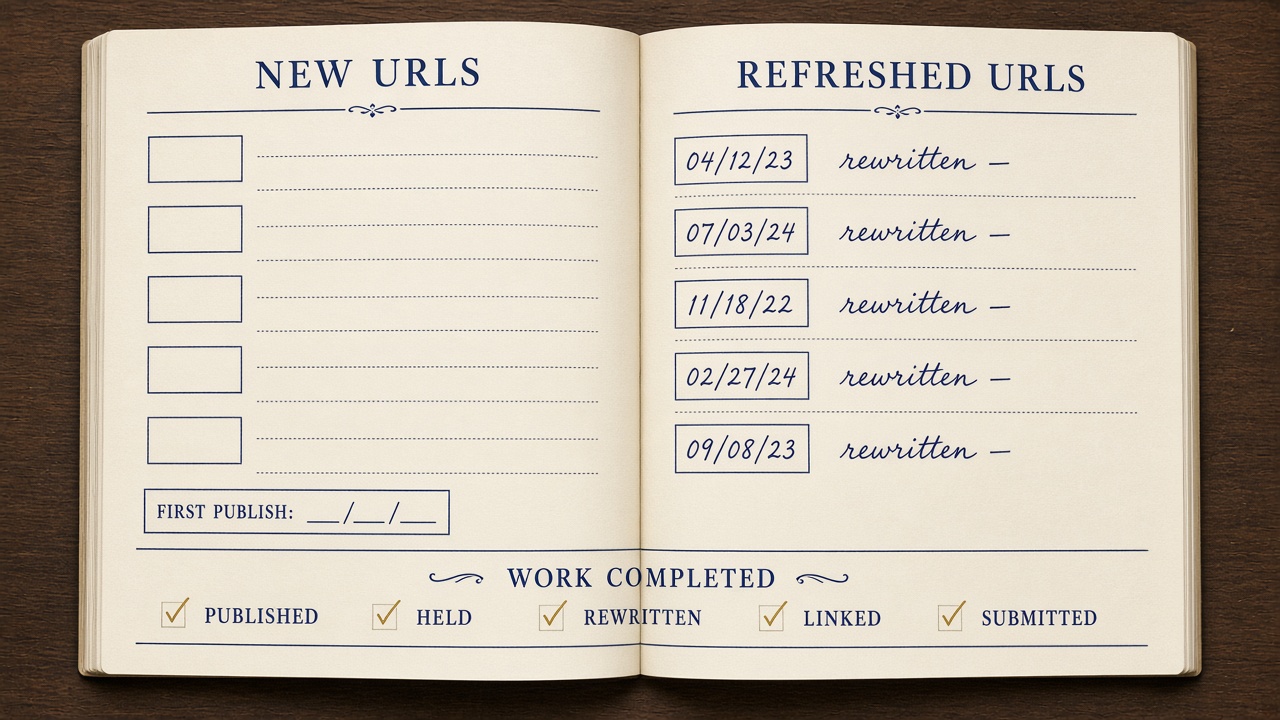
Split every monthly count into new URLs versus refreshed URLs — published, held, indexed, and cost. A refresh that recovers a decaying URL is not a net-new page, and it must not inflate velocity.
The lines that prove the system ran are the work that caused, or should cause, future change — not a traffic swing by itself:
- Pages published and pages held
- Pages rewritten and briefs completed
- Internal links added and pages submitted for indexing
If those rows are zero and traffic still moved, the sheet is an SEO weather report, not an autoblogging report. Require at least one work-completed row before you interpret outcomes, and keep refreshed-page wins in the index-health block so a recovery does not look like scale.
Split the ledger — Count new and refreshed URLs apart, and do not read outcomes until a work-completed row shows the system actually ran.
Key Takeaways
Build next month’s one-page scorecard from the publish contract, template index health, and a separated outcome line before you judge whether the autoblogging system is working.
Frequently Asked Questions
You Might Also Like
- Measurement SEO ROI for Automated Publishing: How to Prove the Stack Is Working
- Measurement AI Visibility Metrics That Matter (and Vanity Numbers to Ignore)
- Automation Automated Blog Posts: Quality Guardrails That Prevent Thin Content
- Guides Quality Checklist for AI-Generated SEO Pages
- Automation What Is Autoblogging? The Fail-Closed System Lean Teams Can Scale