SEO ROI for Automated Publishing: How to Prove the Stack Is Working

Automation makes it easy to ship pages. It does not make it easy to prove those pages paid for themselves. Only 36% of marketers can accurately measure content ROI, even though 83% treat demonstrating it as a priority, and 56% of B2B marketers struggle to attribute returns to content at all. A dashboard that counts published URLs is not a return.
Volume is the wrong proof. Companies publishing 16 or more posts a month can generate 3.5 times the traffic and 4.5 times the leads of teams publishing zero to four—but only if those pages rank and convert. First Page Sage’s split by work type is the caution: basic content marketing of about four average articles a month returns just 16%, while a full thought-leadership program sits with the 748% three-year median. Do not quote that median as a year-one target.
The useful test is fail-closed. Use ((revenue attributed to content − fully loaded content cost) ÷ fully loaded content cost) × 100, and load the cost with editing, expert time, tools, distribution, and refreshes—not writer fees alone. Report organic traffic value as a cost-avoidance proxy, and content-sourced pipeline as the conservative revenue number. Label influenced pipeline separately. Judge the stack on a 12- to 36-month curve, then hold or kill any cluster that is not compounding.
- Content marketing ROI is ((attributed revenue − fully loaded cost) ÷ fully loaded cost) × 100, including editing, expert time, tools, distribution, and refreshes.
- Only 36% of marketers can accurately measure content ROI; a lean scorecard beats a last-click dashboard that hands the close to paid.
- Do not treat a 748% three-year SEO median as a year-one goal—basic publishing of about four average articles a month returns about 16%.
- Report traffic value (clicks × CPC) as a proxy and content-sourced pipeline as the conservative revenue figure; keep influenced pipeline labeled and separate.
- Judge the stack over 12 to 36 months and kill clusters that are indexed but not compounding.
The content marketing ROI formula, and which costs count

Content marketing ROI is ((revenue attributed to content − total content cost) ÷ total content cost) × 100. That is the figure to put in front of finance — and it only holds if you say which revenue definition you used. For an automated publish stack, the conservative number is content-sourced revenue: pipeline or closed revenue you can tie to pages the stack actually published. Organic traffic value, clicks times the cost of equivalent paid clicks, is a cost-avoidance proxy and has to be labeled as one. Content-influenced revenue, where a page merely touched a deal, stays on its own line so it does not inflate the credit.
Writer fees alone understate the stack. Fully loaded content cost includes editing, subject-matter expert or review time, tools, distribution, refreshes, and the human QA gates that keep automation from shipping thin pages. If a review hour or a refresh is what stopped a cluster from decaying, it belongs in the investment, not in a hidden overhead line.
Two unit costs you can audit
- Cost per published page: fully loaded cost divided by pages that actually shipped.
- Cost per indexed page: the same numerator against pages search engines accepted. Volume that never indexes is a cost, not an asset — it raises spend without adding a ranking surface.
What stays human — research, briefs, and the QA gates before publish — is already set out in the automation playbook. This scorecard does not rebuild that workflow. It only prices the output so you can see whether the stack is recovering its fully loaded cost.
Name both sides — Content marketing ROI is only comparable when you name the revenue (content-sourced, with traffic value labeled as a proxy) and load the cost with editing, review, tools, distribution, refreshes, and QA — then check cost per published page against cost per indexed page.
What Is a Good Content Marketing ROI Benchmark for B2B?

With the formula and the fully loaded cost base settled, the number people reach for next is a benchmark. A good content marketing ROI figure for B2B is not one number you paste onto a first-year autoblog. Treat a median three-year SEO ROI of 748%, and 702% for B2B SaaS with breakeven near month 7, as a mature-program reference. Across the same campaign set the all-industry median breaks even closer to nine months. None of those curves is a year-one target for automated publishing.
The useful split is by work type, not by industry slogan. Technical SEO alone averages 117%. Basic content marketing—roughly four average articles a month—returns 16%. A full thought-leadership program averages 748%: original point of view, editing, subject-matter review, and pages that keep compounding. That average lines up with the three-year campaign median, but it is not the mix an automated stack has built yet. Quote either figure without that mix and you are scoring the stack against a program it has not earned.
Broader channel math explains why content can win, and nothing more. Content marketing is often cited as generating three times more leads than outbound marketing at 62% lower cost per lead. That is a reason to fund the channel. It does not prove this publish stack is compounding, because it never sees your indexed rate, your cost per page, or whether a cluster is still earning after the first wave of posts.
Set the internal bar lower and stricter. Beat the 16% basic-blogging outcome by gating quality—human QA, a real brief, and a hold on clusters that are not ranking—rather than by quoting the thought-leadership average. On the same formula already in use, that means conservative content-sourced revenue against fully loaded cost, with organic traffic value labeled as a proxy. Clearing 16% with pages that index and assist pipeline is a working early stack. Claiming the three-year 748% median or the 702% B2B SaaS result in year one is a misread of a mature-program curve.
The bar — For B2B, a good early content marketing ROI benchmark is beating the 16% return of basic blogging by gating quality. The 748% three-year median and the 702% B2B SaaS result, with breakeven near month 7, are mature-program references—not a first-year automated publish target.
Three-Year SEO ROI by Program
How Long SEO Content Takes to Break Even

Beating a thin publishing baseline is only the first gate. SEO content does not break even in the month a page goes live. Across the programs Previsible analyzed, break-even typically landed in months 7 to 11. Judge an automated publish stack on that 12- to 36-month curve, not on a single campaign snapshot. In the same cohort, average organic ROI was 127% by month 12, 384% by month 24, and 946% by month 36.
Content CAC versus paid CAC on the same dates
Compare content CAC with paid CAC on those same dates, not against a blended annual average. Organic cost per lead in that cohort fell from $47 at month 12 to $11 at month 36, while paid lead costs stayed between $163 and $178. Month 24 is the midpoint of the ROI climb (384%), not a separate cost figure you should invent if your own sheet does not yet have it. The compounding signal is paid staying flat while organic cost keeps falling, because pages that already rank keep producing leads without a new media buy.
A separate cited benchmark—$47 content cost per lead versus $121 for paid advertising—is a useful snapshot, not a substitute for your own 12-, 24-, and 36-month curve. Industry averages cannot tell you whether a cluster published last quarter is still paying for itself.
A weak month-12 number is a reason to inspect clusters, not to abandon organic. Editing, review, tools, and refreshes are already in the fully loaded cost; killing the channel because month 12 looks modest throws away the stretch where ROI usually steepens. Hold clusters that are still indexing and ranking. Flag the ones that are not compounding so the next quarter’s budget follows the pages that are.
The curve — Judge the stack from month 12 through month 36. Break-even often arrives in months 7 to 11, and paid CAC staying flat while organic cost per lead falls is the signal the stack is compounding.
Cost per Lead: Organic vs Paid
How to Measure SEO Content ROI Before Closed Revenue

A blank last-click column is not a verdict that the stack failed. Until deals close, measure SEO content ROI with organic traffic value as a cost-avoidance proxy, and keep that figure in its own line so it never stands in for revenue.
What organic traffic value is, and how to calculate it
Organic traffic value is qualified organic clicks multiplied by the cost-per-click you would have paid to buy that same query. Subtract fully loaded content cost—editing, subject-matter review, tools, distribution, and refreshes, not writer fees alone—and you have a proxy return. The arithmetic resembles the ROI formula, but the numerator is media spend you did not have to buy, not closed-won dollars.
Label it proxy value, not revenue. Do not drop traffic value into the ROI formula as if it were closed-won. A page can look profitable on CPC math and still never create a deal; treating the proxy as revenue overstates the stack and makes later pipeline impossible to reconcile.
That gap is not the same as a channel that does not matter. Organic search drives 53% of trackable website traffic, more than any other single channel. In HubSpot’s State of Marketing 2026, 27% of marketers name website, blog, and SEO their top ROI channel, just ahead of paid social at 26%. A zero in last-click revenue is not a zero in channel importance.
Pair the proxy with leading proof the stack can later convert: indexed pages, rankings by brief, and assisted conversions. Those signals show whether pages are earning the right queries, not whether cash has arrived. Once deals exist, content-sourced pipeline replaces traffic value. Do not run both as if they were the same number, and do not add them—one estimates ads you avoided; the other is money entering the funnel.
Proxy, not revenue — Until closed revenue exists, report qualified organic clicks times the CPC you would have paid, minus fully loaded content cost, and label that result proxy value—never revenue. Pipeline takes its place once deals exist.
Content-Sourced vs Content-Influenced Pipeline, and Why Last-Click Hides the Blog

That replacement only works if pipeline is not one bucket. Content-sourced pipeline is the conservative number: opportunities whose first meaningful touch, or whose self-reported discovery, was a content page. Content-influenced pipeline is every later deal a page only assisted. Report them in separate columns. Adding the two, or dropping assisted deals into the ROI formula as if the blog closed them, credits the stack for revenue it did not source.
Last-click attribution is why the blog often reads as zero. The close goes to paid, brand search, or the demo page, and the article that started the search disappears. Informational posts rarely take the last click. They create the assist, then vanish from a dashboard that only remembers the final step.
Visit share makes the same mistake in another form. Across 1,160 sites, the median site got 21.5% of visits from organic search, while organic search accounted for 29% of conversions—more than its share of visits—so counting sessions alone understates organic’s role. A last-click report that ignores assists understates it again.
A one-person publishing stack does not need an enterprise multi-touch model it will not maintain. A sourced-versus-influenced split, plus a short “how did you hear about us” field on the form, is enough to keep conservative revenue honest and still see which posts did quiet work before the close.
Separate columns — Content-sourced pipeline is the conservative revenue number—first meaningful touch or self-reported discovery on a content page. Content-influenced pipeline is the assist list. Keep them in separate columns; last-click hides both by giving the close to paid, brand, or the demo page.
Realistic blog traffic and conversion goals for an automated stack

Realistic goals for an automated publishing stack are set by search intent, not by one blog-wide average. Commercial-investigation posts—comparisons, alternatives, buyer guides—typically convert at 1–3%. Informational posts convert at 0.2–0.8% and earn their keep through assisted conversions, which is why last-click made them look like zero. Meaningful SEO content ROI usually appears at 9–18 months, so an early traffic reading is a diagnostic, not a verdict on the stack.
Publishing more articles does not automatically improve ROI. A heavier calendar lifts traffic and leads only when the extra pages rank and convert inside the intent bands above. A fuller calendar that never earns qualified clicks raises fully loaded cost without moving either number.
The cautionary twin of that volume result is a thin four-post cadence run without a documented strategy or a quality gate. Companies with a documented content strategy are 3.5 times more successful than those without one. Velocity is the input; the gate is what keeps new pages inside the intent bands above. How that line should run—what the autoblog may ship, and what stays human—is in the autoblogging and quality-gate guides. This section only sets the targets those gates are supposed to hit: rankable pages, conversion rates matched to intent, and a 9- to 18-month window before a cluster is called.
Goals by intent — More posts raise traffic and leads only when they rank and convert. Set 1–3% for commercial-investigation pages and 0.2–0.8% for informational assists, and judge the stack on a 9- to 18-month window—not a single blog average.
Attribute Rankings and Pipeline to Briefs, Then Kill What Isn’t Compounding

Attribute rankings and pipeline to the brief, not the individual post. The brief is the unit you can rewrite, merge, or stop; a URL is only one outcome of that decision. Hold a cluster that is indexing and gaining impressions inside the nine- to eighteen-month window already set for a meaningful return. Kill or merge it only after a refresh, and only when it is still not indexed, not earning impressions, and absent from every assisted path.
Roll the score up to the brief
Tag every URL with a brief ID, cluster, intent, and publish date. Rankings, clicks, assists, and content-sourced pipeline then roll up to that brief, because that is the decision you can fix. A post can rank while the brief failed: wrong intent, a cannibalized sibling, or a page that indexes and never assists. Judge the brief’s portfolio, not the hero URL.
When a cluster earns a hold or a kill
A hold is not a pass. It means the cluster is still inside the compounding window and showing the early signs that matter—indexation and rising impressions—so you do not cut it for a slow close. After a refresh, the absence of all three signals is the kill. Merge overlapping briefs rather than leaving sibling pages to compete.
A kill rule is part of ROI. Pages that will never compound keep inflating fully loaded cost—editing, review, tools, distribution, and refreshes—and that cost sits in the denominator for the whole stack. Leave them live and a working cluster looks average even when its own sourced pipeline is sound.
Brief, not post — Roll rankings, assists, and sourced pipeline up to the brief; hold clusters still indexing inside the return window, and kill or merge the rest after a refresh so dead pages stop inflating fully loaded cost.
Monthly KPIs an autoblogging system should report
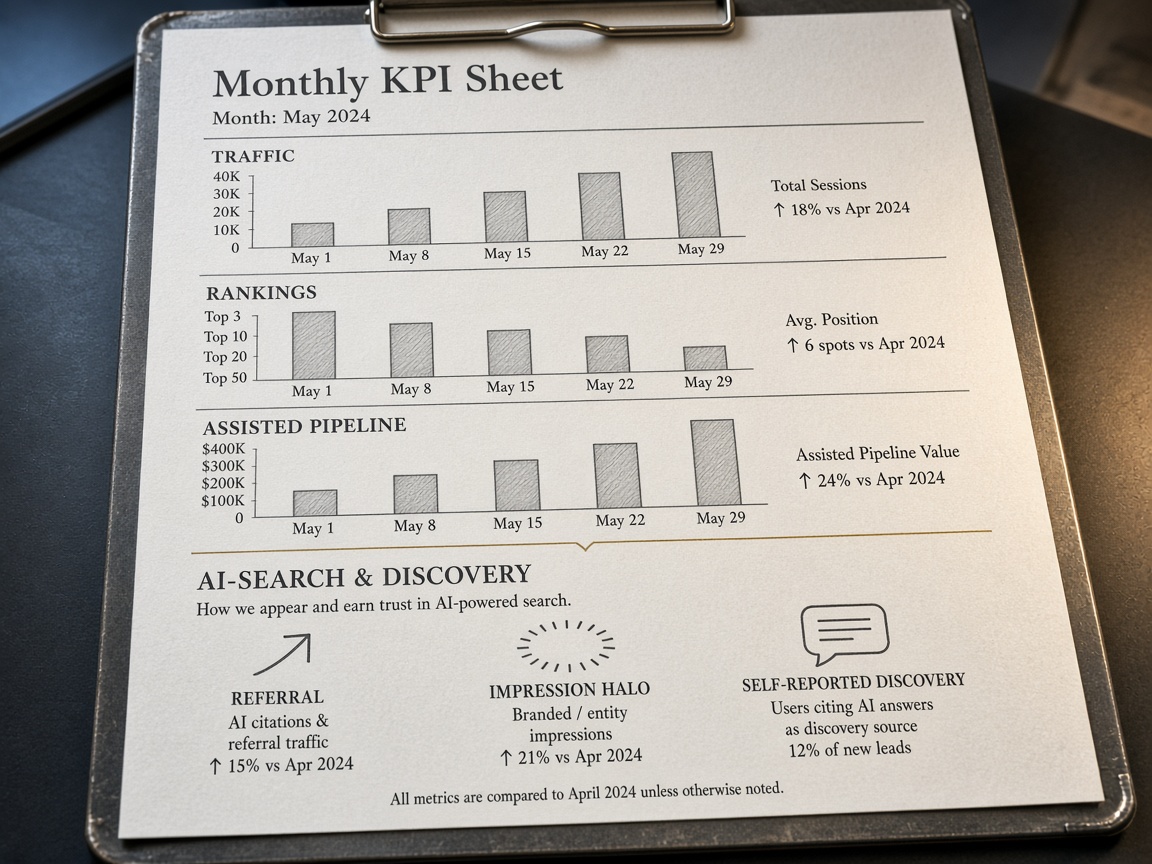
Once a cluster already has a hold or kill call, the autoblogging system owes you one monthly sheet, not another last-click dump. The columns are indexed pages, cost per published page, rankings by brief, organic clicks, traffic value, assisted conversions, content-sourced pipeline, content-influenced pipeline, and a hold or kill flag per cluster. Those nine lines are enough to see whether fully loaded cost is still on a compounding path.
The sheet exists because measurement is still the gap. In CMI’s 2026 B2B research, 33% of 1,015 marketers named measuring effectiveness a top challenge—their third-biggest. A lean scorecard closes that gap better than a dashboard that gives the close to the last click.
Add three AI-search lines, kept off classic organic: AI referral sessions, AI Overview impressions where you can see them, and a self-reported “found you in ChatGPT or Claude.” Do not bury those referrals in session share. Cited benchmarks show AI-referred visitors converting about 14.2% versus 2.8% for classic organic, and one dataset had AI referrals at 0.5% of sessions but 12.1% of signups. A tiny session share can still be a large signup share, so the monthly read has to show both. That is the close of the stack: cost, brief-level organic, split pipeline, a hold or kill flag, and AI search reported on its own lines.
Report both shares — The monthly autoblogging sheet is complete when cost, brief-level organic, split pipeline, a hold or kill flag, and separate AI-search lines sit on one page—and AI referrals are judged by signup contribution, not session percentage alone.
AI Referrals vs Classic Organic
Key Takeaways
Build this month’s autoblogging scorecard with fully loaded cost, a labeled traffic-value proxy, and a hold/kill flag on every brief so you can see whether the stack is actually paying back.
Frequently Asked Questions
You Might Also Like
- Automation Fail-Closed SEO Briefs: The Publish Gate Autoblogging Needs
- Automation Content Marketing Automation: A Practical Playbook
- Automation SEO Automation: Tools, Workflows, and What to Automate First
- Automation AI Content Generator vs Autoblogging System: Which Scales?
- Automation What Is Autoblogging? How Automated SEO Publishing Actually Works